Welcome. If you just can't wait to start playing with the SRTM image data, or just don't have the
patience for reading tedious documentation, you'll need to know at least the following. For more detail
see SRTM_Image.doc.
All SRTM data are divided into tiles extending over 1° x 1° of latitude and longitude, in “geographic”
projection. For the DEMs, data from every acquisition that crossed a tile were mosaicked and combined,
so there is only one data file for each 1° tile. However for image data every data take that crossed a tile
is included as a separate file (no mosaicking or combining has been done) and some files may contain
only partial data. In addition, because of the SCANSAR technique involved, each SRTM swath was
made up of four slightly overlapping subswaths. Data from each subswath is also included in a separate
file, so every image pixel acquired by SRTM is included in this set.
There are two files for each subswath included in a tile:
.mag - radar image data
.inc – local incidence angle for each sample in the image file
Naming convention:
- As with the DEM files, the first 6 characters of each file name for image data indicate the
geographic coordinates of the center of the lower left (southwest) sample of each file.
- For image files this is followed by 6 numbers that indicate the data take number, consisting of
the orbit number followed by a serial number for that orbit.
- This is followed by a subswath number, which increases outward from the spacecraft nadir point,
and is the key to the polarization for that subswath.
o SS1 = subswath 1, HH polarization approx 30° - 43° look angle.
o SS2 = subswath 2, VV polarization approx 44° - 52° look angle.
o SS3 = subswath 3, VV polarization approx 47° - 60° look angle.
o SS4 = subswath 4, HH polarization approx 52° - 62° look angle.
- Example: File N07W081_032_010_SS3_1_01.mag has its lower left sample centered on 7°N
latitude, 81°W longitude, was the 10th data take on orbit 32, and includes data from subswath 3
indicating VV polarization.
Format:
- Both image and incidence angle files are sampled at 1 arc second of latitude and longitude (~ 30
meters at the equator), and are in geographic projection (AKA Plate Caree). Thus both files have
3601 samples and 3601 lines. Incidence angle files were first averaged to 3 arc seconds before
sampling to 1 arc second.
- Image files are 8 bits/sample, with the values indicating radar cross section, or brightness, scaled
linearly between -50 dB and +40 dB. Data numbers (DN) can be converted to backscatter cross
section in dB using the expression dB = 0.3529*DN - 50
- Incidence angle files are 16 bits/sample, measured in hundredths of a degree (i.e. 4321 = 43.21°).
The 2 bytes are in Motorola "big-endian" order with the most significant byte first, directly
readable by systems such as Sun SPARC, Silicon Graphics and Macintosh. DEC Alpha and most
PCs use Intel ("little-endian") order so byte-swapping may be necessary
Showing posts with label Refference. Show all posts
Showing posts with label Refference. Show all posts
Monday, January 17, 2011
SRTM Images
The SRTM data sets result from a collaborative effort by the National Aeronautics and Space
Administration (NASA) and the National Geospatial-Intelligence Agency (NGA - previously known as
the National Imagery and Mapping Agency, or NIMA), as well as the participation of the German and
Italian space agencies, to generate a near-global digital elevation model (DEM) of the Earth using radar
interferometry. The SRTM instrument consisted of the Spaceborne Imaging Radar-C (SIR-C) hardware
set modified with a Space Station-derived mast and additional antennae to form an interferometer with a
60 meter baseline. A description of the SRTM mission can be found in Farr and Kobrick (2007).
Synthetic aperture radars are side-looking instruments and acquire data along continuous swaths. The
SRTM swaths extended from about 30° off-nadir to about 62° off-nadir from an altitude of 233 km, and
thus were about 225 km wide. During the data flight the instrument was operated at all times the orbiter
was over land and about 1000 individual swaths were acquired over the ten days of mapping operations.
Length of the acquired swaths range from a few hundred to several thousand km. Each individual data
acquisition is referred to as a "data take."
SRTM was the primary (and pretty much only) payload on the STS-99 mission of the Space Shuttle
Endeavour, which launched February 11, 2000 and flew for 11 days. Following several hours for
instrument deployment, activation and checkout, systematic interferometric data were collected for
222.4 consecutive hours. The instrument operated almost flawlessly and imaged 99.96% of the targeted
landmass at least one time, 94.59% at least twice and about 50% at least three or more times. The goal
was to image each terrain segment at least twice from different angles (on ascending, or northeast-going,
and descending, or southeast-going, orbit passes) to fill in areas shadowed from the radar beam by
terrain.
This 'targeted landmass' consisted of all land between 56° south and 60° north latitude, which includes
almost exactly 80% of Earth’s total landmass.
2.0 Data Set Characteristics
All SRTM data are divided into tiles extending over 1° x 1° of latitude and longitude, in “geographic”
projection. For the DEMs, data from every acquisition that crossed a tile were mosaicked and combined,
so there is only one data file for each 1° tile. However for image data every data take that crossed a tile
is included as a separate file (no mosaicking or combining has been done) and some files may contain
only partial data. In addition, because of the SCANSAR technique involved, each SRTM swath was
made up of four slightly overlapping subswaths. Data from each subswath is also included as a separate
file, so every image pixel acquired by SRTM is included in this set. Sample spacing for individual data
points is 1 arcsecond; one arc-second at the equator corresponds to roughly 30 meters in horizontal
extent
There are two files for each subswath included in a tile:
.mag - radar image data
.inc – local incidence angle for each sample in the image file
2.1 SRTM Image Data
The long wavelength of radar waves makes them most sensitive to surface roughness at scales near the
radar wavelength (for SRTM, about 5.5 cm). Thus, for example, rough rocky surfaces, wind-roughened
water, and vegetation appear bright while smooth sand and water appear dark in these images. Of
secondary importance is variations in dielectric constant, which is similar for most dry geologic
materials. However, as water has a very high dielectric constant, wet soils tend to show up much
brighter than dry soils. Several texts are available which describe in much more detail processing and
interpretation of radar images (e.g. Elachi, 1988; Henderson and Lewis, 1998; Campbell, 2002).
As radar images are acquired in a side-looking geometry, they can be distorted by topographic
variations. Because SRTM acquired topography at the same time as the image data and the two are
inherently registered, it was an easy matter to orthorectify the image data. This also means that voids
present in the SRTM DEM produce voids in the image data.
The SRTM radar image product provides the mean surface backscatter coefficients of the mapped areas.
This required the image processor to be radiometrically calibrated. For SRTM, the goals for absolute
and relative radiometric calibration were 3 dB and 1 dB respectively. The SRTM main antenna was the
major source of calibration error as it was a large active array antenna. In the spaceborne environment,
both zero gravity unloading and the large variation in temperature caused distortions in the phased array.
Hundreds of phase shifters and transmit / receive modules populated the C-band antenna panels.
Monitoring the performance of each module was very difficult, causing inaccuracies in the antenna
pattern predictions, in particular in elevation, as the beams were spoiled to obtain a wide swath.
Therefore antenna elevation pattern correction coefficients were derived with empirical methods using
data takes over the Amazon rain forest. As the Amazon rainforest is an homogeneous and isotropic area,
the backscatter coefficient is almost independent of the look angle. Without compensation, a scalloping
effect would have been visible in the sub-swath and full-swath images.
Speckle noise is present in the image data. This is a characteristic of coherent imaging systems and
appears as a random, high-frequency, salt and pepper effect. Most imaging radar systems average many
‘looks’, however SRTM was optimized for a wide swath and thus acquired only 1-2 looks per sub-swath
causing a relatively high speckle noise level.
2.2 SRTM Incidence Angle Data
Because local incidence angle is so important for interpretation of radar images, a file containing that
information is provided for each of the image files. The values are calculated from the position of the
Shuttle and the DEM. They represent the angle between the radar beam and the local normal to the
surface at each pixel. Because this information could be used to ‘back-calculate’ a DEM, the incidence
angle pixels were averaged 3x3 and sampled back to 1 arc-second in order to remain registered with the
corresponding image file.
The figure below shows a portion of cell N34W119, demonstrating the characteristics of the image and
incidence angle data sets and the difference with the topographic data.
 Figure 1. Comparison of SRTM image data and SRTM DEM for cell N34W119 (Los Angeles, CA).
Left: Descending sub-swath N34W119_072_100_SS2_1_01. Upper left: Image file, Lower left: Incidence angle file.
Center: Ascending sub-swath N34W119_114_030_SS4_1_01. Upper center: Image file, Lower center: Incidence angle file.
Right: SRTM DEM for the same cell, shaded-relief and elevation color-coded.
Note that the voids in the DEM (shown in grey) correspond to black areas in the image and incidence angle file. The
incidence angle files look like shaded-relief topography because they’re calculated in a similar way. Note that the rough,
vegetated mountains are bright in the images while the smoother Mojave Desert tends to be dark.
3.0 Data Formats
As with the DEM files, the first 6 characters of each file name for image data indicate the geographic
coordinates of the center of the lower left (southwest) sample of each file. For image files this is
followed by 6 numbers that indicate the data take number, consisting of the orbit number followed by a
serial number for that orbit. This is followed by a sub-swath number, which increases outward from the
spacecraft nadir point, and is the key to the polarization for that sub-swath.
o SS1 = sub-swath 1, HH polarization approx 30° - 43° look angle.
o SS2 = sub-swath 2, VV polarization approx 44° - 52° look angle.
o SS3 = sub-swath 3, VV polarization approx 47° - 60° look angle.
o SS4 = sub-swath 4, HH polarization approx 52° - 62° look angle.
Example: File N07W081_032_010_SS3_1_01.mag has its lower left sample centered on 7°N latitude,
81°W longitude, was the 10th data take on orbit 32, and includes data from sub-swath 3 indicating VV
polarization.
SRTM image data are sampled at one arc-second of latitude and longitude and each file contains 3601
lines and 3601 samples. The rows at the north and south edges as well as the columns at the east and
west edges of each cell overlap and are identical to the edge rows and columns in the adjacent cell.
This sampling scheme is sometimes called a "geographic projection", but of course it is not actually a
projection in the mapping sense. It does not possess any of the characteristics usually present in true map
projections, for example it is not conformal, so that if it is displayed as an image geographic features
will be distorted. However it is quite easy to handle mathematically, can be easily imported into most
image processing and GIS software packages, and multiple cells can be assembled easily into a larger
mosaic (unlike the pesky UTM projection, for example.)
3.1 Image File (.mag)
Image brightness or magnitude is given as 8 bits/sample, with the values indicating radar cross section,
scaled linearly between -50 dB and +40 dB. Data numbers (DN) can be converted to backscatter cross
section in dB using the expression dB = 0.3529*DN - 50. There are no header or trailer bytes embedded
in the file. The data are stored in row major order (all the data for row 1, followed by all the data for row
2, etc.).
These data also contain occasional voids from a number of causes such as shadowing, phase unwrapping
anomalies, or other radar-specific causes. Voids have the value 0.
3.2 Incidence Angle File (.inc)
Local incidence angle is provided as 16-bit integer data in a simple binary raster. There are no header or
trailer bytes embedded in the file. The data are stored in row major order (all the data for row 1,
followed by all the data for row 2, etc.). The pixel values represent hundredths of a degree (i.e. 4321 =
43.21°).
Byte order is Motorola ("big-endian") standard with the most significant byte first. Because the
incidence angle data are stored in a 2-byte binary format, users must be aware of how the bytes are
addressed on their computers. The incidence angle data are provided in Motorola or IEEE byte order,
which stores the most significant byte first ("big endian"). Systems such as Sun SPARC and Silicon
Graphics workstations and Macintosh computers use the Motorola byte order. The Intel byte order,
which stores the least significant byte first ("little endian"), is used on DEC Alpha systems and most
PCs. Users with systems that address bytes in the Intel byte order may have to "swap bytes" of the
incidence angle data unless their application software performs the conversion during ingest.
These data also contain occasional voids from a number of causes such as shadowing, phase unwrapping
anomalies, or other radar-specific causes. Voids have the value 0.
Administration (NASA) and the National Geospatial-Intelligence Agency (NGA - previously known as
the National Imagery and Mapping Agency, or NIMA), as well as the participation of the German and
Italian space agencies, to generate a near-global digital elevation model (DEM) of the Earth using radar
interferometry. The SRTM instrument consisted of the Spaceborne Imaging Radar-C (SIR-C) hardware
set modified with a Space Station-derived mast and additional antennae to form an interferometer with a
60 meter baseline. A description of the SRTM mission can be found in Farr and Kobrick (2007).
Synthetic aperture radars are side-looking instruments and acquire data along continuous swaths. The
SRTM swaths extended from about 30° off-nadir to about 62° off-nadir from an altitude of 233 km, and
thus were about 225 km wide. During the data flight the instrument was operated at all times the orbiter
was over land and about 1000 individual swaths were acquired over the ten days of mapping operations.
Length of the acquired swaths range from a few hundred to several thousand km. Each individual data
acquisition is referred to as a "data take."
SRTM was the primary (and pretty much only) payload on the STS-99 mission of the Space Shuttle
Endeavour, which launched February 11, 2000 and flew for 11 days. Following several hours for
instrument deployment, activation and checkout, systematic interferometric data were collected for
222.4 consecutive hours. The instrument operated almost flawlessly and imaged 99.96% of the targeted
landmass at least one time, 94.59% at least twice and about 50% at least three or more times. The goal
was to image each terrain segment at least twice from different angles (on ascending, or northeast-going,
and descending, or southeast-going, orbit passes) to fill in areas shadowed from the radar beam by
terrain.
This 'targeted landmass' consisted of all land between 56° south and 60° north latitude, which includes
almost exactly 80% of Earth’s total landmass.
2.0 Data Set Characteristics
All SRTM data are divided into tiles extending over 1° x 1° of latitude and longitude, in “geographic”
projection. For the DEMs, data from every acquisition that crossed a tile were mosaicked and combined,
so there is only one data file for each 1° tile. However for image data every data take that crossed a tile
is included as a separate file (no mosaicking or combining has been done) and some files may contain
only partial data. In addition, because of the SCANSAR technique involved, each SRTM swath was
made up of four slightly overlapping subswaths. Data from each subswath is also included as a separate
file, so every image pixel acquired by SRTM is included in this set. Sample spacing for individual data
points is 1 arcsecond; one arc-second at the equator corresponds to roughly 30 meters in horizontal
extent
There are two files for each subswath included in a tile:
.mag - radar image data
.inc – local incidence angle for each sample in the image file
2.1 SRTM Image Data
The long wavelength of radar waves makes them most sensitive to surface roughness at scales near the
radar wavelength (for SRTM, about 5.5 cm). Thus, for example, rough rocky surfaces, wind-roughened
water, and vegetation appear bright while smooth sand and water appear dark in these images. Of
secondary importance is variations in dielectric constant, which is similar for most dry geologic
materials. However, as water has a very high dielectric constant, wet soils tend to show up much
brighter than dry soils. Several texts are available which describe in much more detail processing and
interpretation of radar images (e.g. Elachi, 1988; Henderson and Lewis, 1998; Campbell, 2002).
As radar images are acquired in a side-looking geometry, they can be distorted by topographic
variations. Because SRTM acquired topography at the same time as the image data and the two are
inherently registered, it was an easy matter to orthorectify the image data. This also means that voids
present in the SRTM DEM produce voids in the image data.
The SRTM radar image product provides the mean surface backscatter coefficients of the mapped areas.
This required the image processor to be radiometrically calibrated. For SRTM, the goals for absolute
and relative radiometric calibration were 3 dB and 1 dB respectively. The SRTM main antenna was the
major source of calibration error as it was a large active array antenna. In the spaceborne environment,
both zero gravity unloading and the large variation in temperature caused distortions in the phased array.
Hundreds of phase shifters and transmit / receive modules populated the C-band antenna panels.
Monitoring the performance of each module was very difficult, causing inaccuracies in the antenna
pattern predictions, in particular in elevation, as the beams were spoiled to obtain a wide swath.
Therefore antenna elevation pattern correction coefficients were derived with empirical methods using
data takes over the Amazon rain forest. As the Amazon rainforest is an homogeneous and isotropic area,
the backscatter coefficient is almost independent of the look angle. Without compensation, a scalloping
effect would have been visible in the sub-swath and full-swath images.
Speckle noise is present in the image data. This is a characteristic of coherent imaging systems and
appears as a random, high-frequency, salt and pepper effect. Most imaging radar systems average many
‘looks’, however SRTM was optimized for a wide swath and thus acquired only 1-2 looks per sub-swath
causing a relatively high speckle noise level.
2.2 SRTM Incidence Angle Data
Because local incidence angle is so important for interpretation of radar images, a file containing that
information is provided for each of the image files. The values are calculated from the position of the
Shuttle and the DEM. They represent the angle between the radar beam and the local normal to the
surface at each pixel. Because this information could be used to ‘back-calculate’ a DEM, the incidence
angle pixels were averaged 3x3 and sampled back to 1 arc-second in order to remain registered with the
corresponding image file.
The figure below shows a portion of cell N34W119, demonstrating the characteristics of the image and
incidence angle data sets and the difference with the topographic data.
Left: Descending sub-swath N34W119_072_100_SS2_1_01. Upper left: Image file, Lower left: Incidence angle file.
Center: Ascending sub-swath N34W119_114_030_SS4_1_01. Upper center: Image file, Lower center: Incidence angle file.
Right: SRTM DEM for the same cell, shaded-relief and elevation color-coded.
Note that the voids in the DEM (shown in grey) correspond to black areas in the image and incidence angle file. The
incidence angle files look like shaded-relief topography because they’re calculated in a similar way. Note that the rough,
vegetated mountains are bright in the images while the smoother Mojave Desert tends to be dark.
3.0 Data Formats
As with the DEM files, the first 6 characters of each file name for image data indicate the geographic
coordinates of the center of the lower left (southwest) sample of each file. For image files this is
followed by 6 numbers that indicate the data take number, consisting of the orbit number followed by a
serial number for that orbit. This is followed by a sub-swath number, which increases outward from the
spacecraft nadir point, and is the key to the polarization for that sub-swath.
o SS1 = sub-swath 1, HH polarization approx 30° - 43° look angle.
o SS2 = sub-swath 2, VV polarization approx 44° - 52° look angle.
o SS3 = sub-swath 3, VV polarization approx 47° - 60° look angle.
o SS4 = sub-swath 4, HH polarization approx 52° - 62° look angle.
Example: File N07W081_032_010_SS3_1_01.mag has its lower left sample centered on 7°N latitude,
81°W longitude, was the 10th data take on orbit 32, and includes data from sub-swath 3 indicating VV
polarization.
SRTM image data are sampled at one arc-second of latitude and longitude and each file contains 3601
lines and 3601 samples. The rows at the north and south edges as well as the columns at the east and
west edges of each cell overlap and are identical to the edge rows and columns in the adjacent cell.
This sampling scheme is sometimes called a "geographic projection", but of course it is not actually a
projection in the mapping sense. It does not possess any of the characteristics usually present in true map
projections, for example it is not conformal, so that if it is displayed as an image geographic features
will be distorted. However it is quite easy to handle mathematically, can be easily imported into most
image processing and GIS software packages, and multiple cells can be assembled easily into a larger
mosaic (unlike the pesky UTM projection, for example.)
3.1 Image File (.mag)
Image brightness or magnitude is given as 8 bits/sample, with the values indicating radar cross section,
scaled linearly between -50 dB and +40 dB. Data numbers (DN) can be converted to backscatter cross
section in dB using the expression dB = 0.3529*DN - 50. There are no header or trailer bytes embedded
in the file. The data are stored in row major order (all the data for row 1, followed by all the data for row
2, etc.).
These data also contain occasional voids from a number of causes such as shadowing, phase unwrapping
anomalies, or other radar-specific causes. Voids have the value 0.
3.2 Incidence Angle File (.inc)
Local incidence angle is provided as 16-bit integer data in a simple binary raster. There are no header or
trailer bytes embedded in the file. The data are stored in row major order (all the data for row 1,
followed by all the data for row 2, etc.). The pixel values represent hundredths of a degree (i.e. 4321 =
43.21°).
Byte order is Motorola ("big-endian") standard with the most significant byte first. Because the
incidence angle data are stored in a 2-byte binary format, users must be aware of how the bytes are
addressed on their computers. The incidence angle data are provided in Motorola or IEEE byte order,
which stores the most significant byte first ("big endian"). Systems such as Sun SPARC and Silicon
Graphics workstations and Macintosh computers use the Motorola byte order. The Intel byte order,
which stores the least significant byte first ("little endian"), is used on DEC Alpha systems and most
PCs. Users with systems that address bytes in the Intel byte order may have to "swap bytes" of the
incidence angle data unless their application software performs the conversion during ingest.
These data also contain occasional voids from a number of causes such as shadowing, phase unwrapping
anomalies, or other radar-specific causes. Voids have the value 0.
Wednesday, January 12, 2011


Wednesday, January 5, 2011
Pushing N95 to Trnasmit more power
See the attached picture.
Basically, this is a communication path from 3G Power Amplifier (PA) to power controller. When the power controller detected a low voltage from PA, it will tell the PA to rise its power through another path.
Changing the resistor with higher resistance value will drop the voltage to the controller. Thus, the controller will assume that the current power is not enough

---------------------------------------------------------------------------------------------------------
If many "tuned" phones of this kind are on the same cell , UL interference would increase big deal, and you would all experience degradation of 3G services ...
I think not a good idea ... this contrl of power in 3G is even more important than it was in 2G
--------------------------------------------------------------------------------------------------------
But this is the idea how to change your power control :-)
Basically, this is a communication path from 3G Power Amplifier (PA) to power controller. When the power controller detected a low voltage from PA, it will tell the PA to rise its power through another path.
Changing the resistor with higher resistance value will drop the voltage to the controller. Thus, the controller will assume that the current power is not enough
If many "tuned" phones of this kind are on the same cell , UL interference would increase big deal, and you would all experience degradation of 3G services ...
I think not a good idea ... this contrl of power in 3G is even more important than it was in 2G
--------------------------------------------------------------------------------------------------------
But this is the idea how to change your power control :-)
UMTS Question and answer part 5
71. What can we try to improve when access failure is high?
Answer –
• When access failure is high we can try the following to improve RACH performance:
• Increase maximum UE transmit power allowed: Max_allowed_UL_TX_Power.
• Increase power quickly: power_Offset_P0.
• Increase number of preambles sent in a given preamble cycle: preamble_Retrans_Max.
• Increase the number of preamble cycles: max_Preamble_Cycle.
• Increase number of RRC Connection Request retries: N300.
72. What is Eb/No requirement for HSDPA?
Answer –
The Eb/No requirement for HSDPA varies with user bit rate (data rate), typically 2 for 768kbps and 5 for 2Mbps.
73. What HS Channels are introduced in HSDPA in L1?
Answer –
HS-PDSCH – High Speed Physical Downlink Shared Channel
HS-SCCH – High Speed Shared Control Channel
74. How Power Control is implemented in HSDPA?
Answer -Initial Power is set in the same way as open Loop Power control of DCH & there is no further power control on HSDPA Shared Channel HS-DSCH. The Channel Rate is controlled by adaptive modulation & coding formats.
The principles and functionality of the power control for the HSDPA associated dedicated channels are the same as for the DPCH power control.
HS-DPCCH power is an offset relative to DPCCH depending upon whether the UE is in soft handoff or not.
The Power for HS-SCCH is fixed.
75. What FIXED SF is used for HSDPA?
Answer –
SF 16, maximum of 5 codes.
76. What do you understand by CQI Measurements?
Answer – Channel Quality Estimation (CQI) for HSDPA sessions only.
In order to aid scheduling and TFRC selection in the RBS, the UE sends a channel quality indicator (CQI) report on the uplink.
The CQI report estimates the number of bits that can be transmitted to the UE using a certain assumed HS-PDSCH power with a block error rate of 10%
77. What type of Channel Coding is used for Voice and Data services?
Answer –
Voice – Convolution Coding
Data – Turbo coding
Answer –
• When access failure is high we can try the following to improve RACH performance:
• Increase maximum UE transmit power allowed: Max_allowed_UL_TX_Power.
• Increase power quickly: power_Offset_P0.
• Increase number of preambles sent in a given preamble cycle: preamble_Retrans_Max.
• Increase the number of preamble cycles: max_Preamble_Cycle.
• Increase number of RRC Connection Request retries: N300.
72. What is Eb/No requirement for HSDPA?
Answer –
The Eb/No requirement for HSDPA varies with user bit rate (data rate), typically 2 for 768kbps and 5 for 2Mbps.
73. What HS Channels are introduced in HSDPA in L1?
Answer –
HS-PDSCH – High Speed Physical Downlink Shared Channel
HS-SCCH – High Speed Shared Control Channel
74. How Power Control is implemented in HSDPA?
Answer -Initial Power is set in the same way as open Loop Power control of DCH & there is no further power control on HSDPA Shared Channel HS-DSCH. The Channel Rate is controlled by adaptive modulation & coding formats.
The principles and functionality of the power control for the HSDPA associated dedicated channels are the same as for the DPCH power control.
HS-DPCCH power is an offset relative to DPCCH depending upon whether the UE is in soft handoff or not.
The Power for HS-SCCH is fixed.
75. What FIXED SF is used for HSDPA?
Answer –
SF 16, maximum of 5 codes.
76. What do you understand by CQI Measurements?
Answer – Channel Quality Estimation (CQI) for HSDPA sessions only.
In order to aid scheduling and TFRC selection in the RBS, the UE sends a channel quality indicator (CQI) report on the uplink.
The CQI report estimates the number of bits that can be transmitted to the UE using a certain assumed HS-PDSCH power with a block error rate of 10%
77. What type of Channel Coding is used for Voice and Data services?
Answer –
Voice – Convolution Coding
Data – Turbo coding
UMTS Question and answer part 4
61. What could be the cause of soft handover failure?
Answer –
• Undefined neighbors
• One way Neighbor definition
• UE issue.
• Resource unavailable at target NodeB.
• Inadequate SHO threshold defined.
62. What are the three sets in handover?
Answer –
Active Set
Monitored Set
Detected Set
63. What are the major differences between GSM and UMTS handover decision?
Answer –
GSM:
• Time-based mobile measures of RxLev and RxQual – mobile sends measurement report every SACH period (480ms).
• BSC instructs mobile to handover based on these reports.
UMTS:
• Event-triggered reporting – UE sends a measurement report only on certain event “triggers”.
• UE plays more part in the handover decision.
64. What are the events 1a, 1b, 1c, etc.?
Answer –
e1a – a Primary CPICH enters the reporting range, i.e. add a cell to active set.
e1b – a primary CPICH leaves the reporting range, i.e. removed a cell from active set.
e1c – a non-active primary CPICH becomes better than an active primary CPICH, i.e. replace a cell.
e1d: change of best cell.
e1e: a Primary CPICH becomes better than an absolute threshold.
e1f: a Primary CPICH becomes worse than an absolute threshold.
65. What are event 2a-2d and 3a-3d?
Answer –
Events 2a-2d are for inter-frequency handover measurements and events 3a-3d are for IRAT handover measurements.
e3a: the UMTS cell quality has moved below a threshold and a GSM cell quality had moved above a threshold.
e3b: the GSM cell quality has moved below a threshold.
e3c: the GSM cell quality has moved above a threshold.
e3d: there was a change in the order of best GSM cell list.
66. What may happen when there’s a missing neighbor or an incorrect neighbor?
Answer –
• Access failure and handover failure: may attempt to access to a wrong scrambling code.
• Dropped call: UE not aware of a strong scrambling code, strong interference.
• Poor data throughput.
• Poor voice quality.
• Etc.
67. How is inter-frequency Handover triggered?
Answer –
The network decides that inter frequency measurements need to be performed and sends the MEASUREMENT CONTROL MESSAGE with Measurement type set to Inter-Frequency measurements. Generally it will set an Event as well along with the measurements. The following are list of Events that can trigger Measurement Report.
• Event 2a: Change of Best Frequency
• Event 2b: The estimated quality of the currently used frequency is below a certain threshold and the estimated quality of a non-used frequency is above a certain threshold
• Event 2c: The estimated quality of a non-used frequency is above a certain threshold
• Event 2d: The estimated quality of the currently used frequency is below a certain threshold
• Event 2e: The estimated quality of a non-used frequency is below a certain threshold
• Event 2f: The estimated quality of the currently used frequency is above a certain threshold
The Inter-Frequency Handover Evaluation bases its decision on P-CPICH quality measures on the currently used frequency and on one or more non-used frequencies. If the evaluation result is positive, one cell on a non-used frequency is proposed to Inter-Frequency handover Execution.
Inter-Frequency Handover is a hard handover where the UE is ordered by the network to tune to another frequency. This means that there will be small interruptions in the data flow to and from the UE.
68. What kind of Handover takes place in Load Sharing?
Answer –
It’s a blind handover to the co-located cell. IFHO i.e.
69. What do you understand by IFHO?
Answer –
IFHO – Inter Frequency Handover
70. What do you understand by Directed Retry?
Answer –
When there is a co-existing GSM RAN, excess traffic in a WCDMA cell may be off-loaded to GSM
If a call is chosen for Directed Retry to GSM, the request for the speech RAB will be rejected with cause "Directed retry" and then a request is made to the core network to relocate the UE to a specific GSM cell, using the Inter-RAT handover procedure. This handover is a blind one since the target cell is chosen not based on UE measurements. Therefore, the target cell must be co-located with the WCDMA cell. Co-located GSM cells are assumed to have similar coverage and accessibility as their respective WCDMA cells.
Answer –
• Undefined neighbors
• One way Neighbor definition
• UE issue.
• Resource unavailable at target NodeB.
• Inadequate SHO threshold defined.
62. What are the three sets in handover?
Answer –
Active Set
Monitored Set
Detected Set
63. What are the major differences between GSM and UMTS handover decision?
Answer –
GSM:
• Time-based mobile measures of RxLev and RxQual – mobile sends measurement report every SACH period (480ms).
• BSC instructs mobile to handover based on these reports.
UMTS:
• Event-triggered reporting – UE sends a measurement report only on certain event “triggers”.
• UE plays more part in the handover decision.
64. What are the events 1a, 1b, 1c, etc.?
Answer –
e1a – a Primary CPICH enters the reporting range, i.e. add a cell to active set.
e1b – a primary CPICH leaves the reporting range, i.e. removed a cell from active set.
e1c – a non-active primary CPICH becomes better than an active primary CPICH, i.e. replace a cell.
e1d: change of best cell.
e1e: a Primary CPICH becomes better than an absolute threshold.
e1f: a Primary CPICH becomes worse than an absolute threshold.
65. What are event 2a-2d and 3a-3d?
Answer –
Events 2a-2d are for inter-frequency handover measurements and events 3a-3d are for IRAT handover measurements.
e3a: the UMTS cell quality has moved below a threshold and a GSM cell quality had moved above a threshold.
e3b: the GSM cell quality has moved below a threshold.
e3c: the GSM cell quality has moved above a threshold.
e3d: there was a change in the order of best GSM cell list.
66. What may happen when there’s a missing neighbor or an incorrect neighbor?
Answer –
• Access failure and handover failure: may attempt to access to a wrong scrambling code.
• Dropped call: UE not aware of a strong scrambling code, strong interference.
• Poor data throughput.
• Poor voice quality.
• Etc.
67. How is inter-frequency Handover triggered?
Answer –
The network decides that inter frequency measurements need to be performed and sends the MEASUREMENT CONTROL MESSAGE with Measurement type set to Inter-Frequency measurements. Generally it will set an Event as well along with the measurements. The following are list of Events that can trigger Measurement Report.
• Event 2a: Change of Best Frequency
• Event 2b: The estimated quality of the currently used frequency is below a certain threshold and the estimated quality of a non-used frequency is above a certain threshold
• Event 2c: The estimated quality of a non-used frequency is above a certain threshold
• Event 2d: The estimated quality of the currently used frequency is below a certain threshold
• Event 2e: The estimated quality of a non-used frequency is below a certain threshold
• Event 2f: The estimated quality of the currently used frequency is above a certain threshold
The Inter-Frequency Handover Evaluation bases its decision on P-CPICH quality measures on the currently used frequency and on one or more non-used frequencies. If the evaluation result is positive, one cell on a non-used frequency is proposed to Inter-Frequency handover Execution.
Inter-Frequency Handover is a hard handover where the UE is ordered by the network to tune to another frequency. This means that there will be small interruptions in the data flow to and from the UE.
68. What kind of Handover takes place in Load Sharing?
Answer –
It’s a blind handover to the co-located cell. IFHO i.e.
69. What do you understand by IFHO?
Answer –
IFHO – Inter Frequency Handover
70. What do you understand by Directed Retry?
Answer –
When there is a co-existing GSM RAN, excess traffic in a WCDMA cell may be off-loaded to GSM
If a call is chosen for Directed Retry to GSM, the request for the speech RAB will be rejected with cause "Directed retry" and then a request is made to the core network to relocate the UE to a specific GSM cell, using the Inter-RAT handover procedure. This handover is a blind one since the target cell is chosen not based on UE measurements. Therefore, the target cell must be co-located with the WCDMA cell. Co-located GSM cells are assumed to have similar coverage and accessibility as their respective WCDMA cells.
UMTS Question and answer part 3
44. Which link is required to perform Inter RNC SHO?
Answer -Iur
45. What is “noise rise”? What does a higher noise rise mean in terms of network loading?
Answer - For every new user added to the service, additional noise is added to the network. That is, each new user causes a “noise rise”. In theory, the “noise rise” is defined as the ratio of total received wideband power to the noise power. Higher “noise rise” value implies more users are allowed on the network, and each user has to transmit higher power to overcome the higher noise level. This means smaller path loss can be tolerated and the cell radius is reduced. To summarize, a higher noise rise means higher capacity and smaller footprint, a lower noise rise means smaller capacity and bigger footprint.
46. What is Pilot Pollution?
Answer - Simply speaking, when the number of strong cells exceeds the active set size, there is “pilot pollution” in the area. Typically the active set size is 3, so if there are more than 3 strong cells then there is pilot pollution.
Definition of “strong cell”: pilots within the handover window size from the strongest cell. Typical handover window size is between 4 to 6dB. For example, if there are more than 2 cells (besides the strongest cell) within 4dB of the strongest cell then there is pilot pollution.
47. How many fingers does a UE rake receiver have?
Answer – 4
48. What is “compressed mode”?
Answer - Compressed mode is a physical layer function that allows the UE to temporarily tune to another frequency, and measure the RF environment of another UMTS frequency (e.g. IFHO) or another technology (e.g. IRAT), while maintaining an existing dedicated channel
49. When in 3-way soft handover, if a UE receives power down request from one cell and power up request from the other 2 cells, should the UE power up or down and why?
Answer - UE will power down because if a cell is able to sustain a good connection with one cell on lower power level it will discard power up messages from other cells. It also helps in maintaining low interference level for other surrounding UE’s.
50. Suppose two UE are served by the same cell, the UE with weaker link (poor RF condition) uses more “capacity”, why does this mean?
Answer -The UE with weaker RF link will require NodeB to transmit higher traffic power in order to reach the UE, resulting in less power for other UE – therefore consumes more “capacity
51. Under what circumstances can a NodeB reach its capacity? What are the capacity limitations?
Answer -NodeB reaches its maximum transmit power, runs out of its channel elements, uplink noise rise reaches its design target, etc.
52. What is “cell breathing” and why?
Answer - The cell coverage shrinks as the loading increases, this is called cell breathing.
In the uplink, as more and more UE are served by a cell, each UE needs to transmit higher power to compensate for the uplink noise rise. As a consequence, the UE with weaker link (UE at greater distance) may not have enough power to reach the NodeB – therefore a coverage shrinkage.
In the downlink, the NodeB also needs to transmit higher power as more UE are being served. As a consequence UE with weaker link (greater distance) may not be reachable by the NodeB.
53. If you have 3 cells in your Active Set and a drop call occurs, which Cell a Drop call would be pegged?
Answer - Serving Cell in Active Set
54. Is UMTS an uplink-limited or downlink-limited system?
Answer – Initially, A typical WCDMA network is Uplink Limited. Later a Loaded Network becomes Downlink Limites.
55. What is OCNS?
Answer - Orthogonal Carrier Noise Simulator
56. Briefly describe Capacity Management and its functions?
Answer - Capacity Management is responsible for the control of the load in the cell. It consists of 3 main functions:
1. Dedicated Monitored Resource Handling: tracks utilization of critical resources of the system.
2. Admission Control: accepts/refuses admission requests based on the current load on the dedicated monitored resources and the characteristics of the request
3. Congestion Control: detects/resolves overload situations
57. What Resources are monitored for Capacity Management?
Answer –
DL Power
Received Total Wideband power
OVSF Codes
RBS Channel Elements
58. What Radio Measurements are used for Congestion Monitoring?
Answer –
Downlink Received Power
Uplink Received Total Wideband Power
59. Are System Information Blocks (SIB) transmitted all the time?
Answer - Yes
60. How does UE camp (synchronize) to a NodeB?
Answer –
1. UE uses the primary synchronization channel (P-SCH) for slot alignment (TS synchronization).
2. After aligning to NodeB time slot, UE then uses secondary synchronization channel (S-SCH) to obtain frame synchronization and scrambling code group identification.
3. UE then uses scrambling code ID to obtain CPICH, thus camping to a NodeB.
UMTS Question and answer part 2
22. What is cell selection criterion?
Answer - Cell selection is based on:
•Qmean: the average SIR of the target cell.
•Qmin: minimum required SIR.
•Pcompensation: a correction value for difference UE classes.
S = Qmean - Qmin - Pcompensation
•If S>0 then the cell is a valid candidate.
•A UE will camp on the cell with the highest S.
23. Idle Mode Behaviour is managed by System information send on which L3 Channel?
Answer – BCH
24. How many Radio Bearers (RB) are involved in CS voice call?
Answer – 3
25. How many Service Radio Bearers (SRB) are involved in CS voice call?
Answer – 4
26. SCH channel consists of how many chips?
Answer -256 chips
27. What do you understand by DRX cycle?
Answer - The UE listens to the PICH only at certain predefined times, reducing power consumption. The periodicity of these searches is set by the system and the time interval is called Discontinuous Reception (DRX) cycle.
Different DRX cycles are used for circuit switched and packet switched services in Idle mode. A separate DRX cycle is also used to page Connected mode UEs in state URA_PCH.
28. Cell Reselection is valid in both Idle and in which Sate in Connected mode?
Answer - CELL FACH
29. Difference between PICH and PCH?
Answer - PICH-Paging Indicator Channel
PCH-Paging Channel
PICH is used to indicate UE to when it should read to S-CCPCH (Carries PCH) whereas PCH is used to carry RRC Message “Paging type 1” which contains actual Paging information.
30. When is System information sent to UE?
Answer - The system information is regularly broadcast to the UE on the BCCH. When a parameter in the system information is changed, all UE in a cell are notified by a paging message or by a system information change indication message.
31. Explain Timer T3212?
Answer -Periodic LA and RA updating is used to notify the network of the UEs availability, and to avoid unnecessary paging attempts for a UE that has lost coverage and is not able to inform the CN that it is inactive.
The periodic LA update procedure is controlled by a timer, called t3212, which gives the time interval between two consecutive periodic location updates. The value is sent by the WCDMA RAN to UEs on the BCCH.
32. Explain Near far effect?
Answer;-All users use the same bandwidth at the same time and therefore users interfere with one another. Due to the propagation path loss, the signal received by the base station from a UE close to the base station will be stronger than the Signal received from another terminal located at the boundary. Hence, the distant user will be dominated by the close user. This is called the near-far effect. To achieve a considerable capacity, all signals, irrespective of distance, should arrive at the base station with the same mean power. A solution to this problem is power control, which attempts to achieve the same mean received power for each user.
33. Name three loops in Power control In WCDMA? Explain them briefly.
Answer; - Open Loop
Inner Loop
Outer Loop
Open Loop Power control
The open-loop power control technique requires that the transmitting entity measures the channel interference and adjusts its transmission power accordingly. This can be done quickly, but the problem is that the interference estimation is done on the received signal, and the transmitted signal probably uses a different frequency, which differs from the received frequency by the system’s duplex offset. As uplink and downlink fast fading (on different frequency carriers) do not correlate, this method gives the right power values only on average.
Inner Loop
In this method the received signal-to interference ratio (SIR) is measured over a 667-microsecond period (i.e., one time slot), and based on that value, a decision is made about whether to increase or decrease the transmission power in the other end of the connection. Note that the delay inherent in this closed-loop method is compensated for by making the measurements over a very short period of time. The transmit power control (TPC) bits are sent in every time slot within the uplink and the downlink. There is not a neutral signal; all power control signals contain either an increase or decrease command.
Outer Loop
The outer loop power control functions within the base station system, and adjusts the required SIR value (SIRtarget), which is then used in the inner loop control. Different channel types, which can be characterized by, for example, different coding and interleaving methods, constitute a channel’s parameters. Different channel parameters may require different SIRtarget values. The final result of the transmission process can only be known after the decoding process, and the resulting quality parameter is then used to adjust the required SIR value. If the used SIR value still gives a low quality bit stream, then the outer loop power control must increase the SIRtarget value. This change in the outer loop will trigger the inner loop power control to increase the mobile station transmission power accordingly
34. What is SIR?
Answer - SIR is the Signal-to-Interference Ratio – the ratio of the energy in dedicated physical control channel bits to the power density of interference and noise after dispreading.
35. How many time Inner Loop Power Control happens and what type of fading it compensates?
Answer - 1500Hz and compensates Fast Fading.
36. What is BLER?
Answer - Block Error Rate
37. How is Initial RACH Power is calculated?
Answer - The initial power on the PRACH - the power of the first preamble - is determined according to equation
P_PRACH = L_PCPICH + RTWP + constantValueCprach
Where L_PCPICH is the path loss estimated by UE since it knows transmit & receive CPICH power
RTWP is received Total Wideband Power(uplink interference) measured by RBS .
constantValueCprach is used by the UE to calculate the initial power on the PRACH . This parameter is configurable and decides at which level below RTWP preamble ramping will start.
38. What power RACH message Control Part is sent?
Answer - The power of the control part of the RACH message is determined by the power of the last transmitted preamble and by a configurable offset powerOffsetPpm
39. Briefly describe why open loop power control is needed and how it works?
Answer -Open Loop power control is used when no feedback mechanism is possible. An estimate of the required power is made from measurements and system information.
This is used for initial network access and finding initial power settings during dedicated mode.
40. Explain the functionality of TPC?
Answer – During Power Control, Transmit Power control(TPC) commands are used to power up or power down based on SIR target in the step of 0.5 dB ( 1 dB if the connection is made over Iur).
41. How many types of handovers are there in UMTS?
Answer –
Soft/Softer Handover
Inter Frequency Handover
Inter RAT Handover
Core Network Hard Handover
Service based handover to GSM
HSDPA Mobility
42. Explain Soft and Softer handover? Give some advantage and disadvantage for soft handover. What is the target for soft handover in WCDMA networks?
Answer - In Soft Handover, the UE connection consists of at least two radio links established with cells belonging to different RBSs. In Softer handover, the UE connection consists of at least two radio links established with cells belonging to the same RBS.
It acts as macro diversity since UE is connected to more than one radio link at any given point, adds redundancy and reduces interference.
However there is a tradeoff between soft/softer handover & system capacity.
A UE involved in Soft/Softer Handover uses several radio links, more DL channelization codes, and more DL power than a single-link connection. Consequently, if all the UEs connected to a particular RNC are considered, more resources are needed in the RBSs, more resources over the Iub and Iur interfaces, and more resources in the RNC. For this reason, the number of radio links involved in the Soft/Softer handover must be limited
A typical target for soft handover in WCDMA network is less than or equal to 30%
43. Define Active Set? Pros and Cons of having a small or longer Active Set.
Answer - Active Set consists of group of cells that takes part in soft/softer handover & measure by UE.
Typical size of Active set is 3 or 4 & generally a standard practice in all WCDMA networks.
A small active set size may provide more resources available due to less soft/softer handover but at the expense of handover gain thereby reducing the capacity & link redundancy
Tuesday, January 4, 2011
GSM RF INTERVIEW QUESTIONS
1.What are the three services offered by GSM? Explain each of them briefly.
2.Which uplink/downlink spectrum is allocated to GSM-900?
3.Which uplink/downlink spectrum is allocated to DCS-1800?
4.How many carrier frequencies are there in GSM-900/DCS-1800? How much is the separation between the carrier frequencies?
5.What is Ciphering? Why do we need it? Name the algorithm(s) used in it?
6.What is Authentication? Why do we need it? Name the algorithm(s) used in it?
7.What is equalisation? Why do we need it?
8.What is Interleaving? Why do we need it?
9.Why do we need digitisation?
10.Explain Speech Coding.
11.What is channel coding?
12.What do you mean by Frequency re-use?
13.What is Cell Splitting?
14.Name the interfaces between a) BTS and MS b) BTS and BSC c) BSS and MSC d) TRAU and BSC e)BSC and PCU
15.What are LAPD and LAPDm?
16.What is WPS?
17.What is MA?
18.What is MAIO?
19.What is the difference between Synthesised Frequency Hopping and Base Band Frequency Hopping?
20.What is Cycling Frequency Hopping?
21.What is HSN? How do we apply it?
22.What is DTX? Why is it used?
23.What is DRX? Why do we need it?
24.What is the gross data rate of GSM?
25.What is Erlangs? What is meant by GoS?
26.We use two different bands for GSM/DCS communications; GSM900 and DCS-1800. Which one is the better of the two in terms of quality and coverage?
27.What is TA? Why do we need TA?
28.What is meant by Location Area?
29.What is location update? Why do we need location update?
30.What is meant by IMSI, TMSI, IMEI and MS-ISDN? Why they are needed?
31.What is ARFCN? Which ARFCNs are allocated to Ufone?
32.Explain Power Control.
33.What is the difference between FDD and TDD?
34.What is an extended cell? How does it impact the system? Channels and TDMA structure
35.Why do we use Multiple Access Schemes? What is the difference between FDMA, TDMA and CDMA?
36.Which channel(s) is used for SMS?
37.Which channel is used by MS to request access to the network?
38.What is AGCH?
39.Why do we need SDCCH?
40.What is a physical channel? How do we differentiate between physical and logical channels?
41.What are TDMA frames, multiframes, superframes and hyperframes?
42.Why do we need FCCH, SCH and BCCH?
43.Why do we need SACCH?
44.What is the purpose of PCH and CBCH?
45.Do we keep BCCH on a hopping radio? Give the reason to support your answer.
46.How much delay is present between downlink and uplink frames? Why do we need this delay?
47.Explain the structure of a Traffic Multiframe. Why do we need SACCH and Idle bursts in a traffic multiframe?
48.How is a FACCH formed? When is a FACCH used?
49.What are bursts? Explain various types of bursts. Radio Propagation and Antennas
50.What is VSWR? Why do we need it?
51.What do you mean by EIRP?
52.What is Polarisation? What are the types of polarisation?
53.What is fading? What are its different types: a) Based on Multipath time delay spread b) Based on Doppler Spread?
54.What is Rayleigh Fading?
55.What is multipath fading?
56.How can we minimise multipath fading?
57.What are the different types of diversity?
58.Explain various types of Antenna Diversity?
59.Explain Frequency Diversity.
60.Explain Time Diversity.
61.What are the basic mechanisms of propagation?
62.What do you mean by Diffraction?
63.What is knife-edge diffraction?
64.What is Scattering?
65.What is FSPL?
66.What is meant by Fresnel zone and Fraunhofer zone?
67.What is beamwidth? What is the relation of beamwidth to length of antenna?
68.Define: a) Bandwidth, b) 3dB Bandwidth and c) absolute Bandwidth d) Coherence Bandwidth e) Modulation Bandwidth f) Null-to-Null Bandwidth?
69.What do we understand from the terms a) SNR b) F/B ratio? Handovers
70.What are the types of Handovers (intra-bsc, inter-msc, etc)?
71.What can be the reasons of Handover Failure?
72.What is the difference between a soft handover and a hard handover?
73.What are SYNC handovers? How are the different from asynchronous handovers?
74.What are emergency handovers?
75.What are the different types of Handovers? (PBGT, Quality, Level, etc)
76.How do we classify the handovers on the basis of decision making?
77.What are Vertical and Horizontal handovers?
78.What is “Multilayer Handoff” Strategy? What is “Ping pong effect” and “take-back”?
79.Who makes the handover decisions in GSM?
80.What is the role of the MSC in handovers?
81.What is the role of the MS in handovers? Modulation
82.Which modulation scheme is used in GSM? Explain.
83.What is the difference between PSK, ASK and FSK?
84.What are QPSK and OQPSK?
85.What is MSK? What is its application in GSM?
86.What is QAM? What is its application in GSM?
87.What is meant by PAM and PCM? What is its application in GSM?
88.Explain FDM, TDM and OFDM.
89.Which modulation scheme is used in GPRS? In EDGE? Explain/Compare. Drive Testing
90.What is C/I?
91.What is C/A?
92.What is RxQual? How do we relate it to BER?
93.What is the difference between BER-Full and BER-Sub?
94.What is SQI? Why do we prefer it over RxQual?
95.What is BSIC? Why do we need it?
96.What is AMR?
97.What can be the reasons of a Call drop?
98.What are counters? Why do we need them?
99.When do we need drive test?
100.What is cell-reselection?
101.What are C1 & C2?
102.What is call re-establishment?
103.Why do we make “short calls” and “long calls” during drive test?
104.What do you mean by CEFR and CSSR?
105.What is RSSI?
106.What is the difference between RxLev and RxQual?
107. What is the difference between FER and BER? Procedures
108.What is cell selection? How does MS select a cell?
109.Explain the call flow for MOC and MTC.
110.Handover procedures.
111.How does a MS get “registered” with the network? (Explain IMSI attach procedure) GPRS and EDGE
112.What is GPRS?
113.What is the basic difference between GSM and GPRS architecture?
114.What makes GPRS technology different from traditional GSM?
115.What are the functions of GGSN and SGSN?
116.How many coding schemes are used in GPRS? Why are they important?
117.What is the gross data rate offered by GPRS and EDGE?
118.What is EDGE? How is it different from normal GSM/GPRS?
119.How do we classify GPRS terminals? GSM System Architecture
120.What are the main components of BSS?
121.What are the main components of NSS?
122.Why do we need HLR and VLR?
123.Why do we need EIR and AuC?
124.What is RBS?
125.What are the paging limitations of a BSC?
126.What is a coupling system?
127.What do we mean by E1 and T1?
Case Study 1
Case Study: 1 km high tower in Delhi. Discuss.
Case Study 2
Case Study:
Two cells having same BCCH. Discuss.
Case Study 3
Case Study: LAC size. The whole Delhi being given one LAC VS each cell having its own LAC.
REPORT ON MASS COMMAND SOLUTION IN HLR
REPORT ON MASS COMMAND SOLUTION IN HLR
The is a report on usage and advantages of the tool Gonzales which is very useful for mass command exercises in HLR with respect to O&M activities .
1 Introduction
The Tool Gonzales has been used to execute mass commands in HLR with APG and its been found very effective as the output results are much faster than the mml commands or even HGMCI Command, This can help us all in Important migrations like HLR, SCP or SDP migrations. The tool has been tested successfully in few important migrations in north.
• The commands can be checked for any possible error with different procedure options.
• The average time for executing 1 Lac mml commands is around 7 mins..
• The mass execution is always recommended in off peak hours as processor load shoots up to 30-40%.
• Error result in executing any command will be captured in the output logs and can be checked and corrected.
2 Existing difficulties in Handling Mass Command Activities
1. Executing DT’s of mml commands from normal desktops is quite time consuming. Hence all the activities involving mass change in subscriber’s profile in HLR results in either delay in completion of the migration activities or errors in running DT’s manually are found out after quite some time which may be leading to revenue loss or customer dissatisfaction.
2. Sometimes, speed of mml session becomes very slow due to more parallel sessions resulting in much time for executing mml commands.
3. To manage the multiple mml sessions in HLR sometimes
3 How we can use this for O& M Activities
We can use Gonzales and IOCMI command to run any mml command in HLR or any AXE node. The testing has been done for HLR with APG only.The complete procedure can be simply divided into three parts.
3.1 Prepare the load file through Gonzales
All mml commands which are to be executed in HLR can be captured in a CMD file. It is always recommended to put a maximum of 1 Lac commands in a single CMD file as it keeps the processor load of CP within safe limit. Following is the procedure to make loadfile from the tool
• Use the File menu and click “Open” option.
• Select the CMD file where you have kept the commands.
• The screen will show you list of three processed files as shown below
 • All three file will be automatically saved where CMD file is kept.
• The load file which is without any extension (first in the list as shown above) is the actual load file which is to be used further.
• It is recommended to rename the CMD filenames as acloadfile1 and next CMD filename as acloadfile2 and so on.
3.2 Transfer the load file in AP of HLR
After selecting the Load file, the next task is to transfer the file from your desktop to CP; the following steps will cover the procedure
• Login into the cluster of the the APG using pcAnywhere.
• Open the following directory in L drive of the APG
L:\FMS\Data\tmp\
• Make a new directory in the current “tmp” folder using mkdir command
mkdir Gonzales
• This will be a temporary folder which can be deleted after the completion of the activity.
• Now using the File Transfer Application of the APG.transfer the load file from your desktop to the following location of the APG.
L:\FMS\Data\tmp\gonzales
3.3 Executing Mass Commands
The Load file which is kept in the L drive of the APG is to be shifted to CP before running this load file. But we need a temporary CP file which will be used to keep the contents of this loadfile. ; the following steps will cover the procedure
• Create a CP file by using the command cpfmkfile, name the CP file as “acloadfile”
cpfmkfile -l 512 -c acloadfile relvolumsw
• Check the contents of the file by cpfls command.
L:\FMS\Data\tmp\gonzales>cpfls –l acloadfile
CPF FILE TABLE
FILE TYPE CMP VOLUME
ACLOADFILE reg yes RELVOLUMSW
TRANSFER QUEUE MODE
RLENGTH MAXSIZE MAXTIME REL ACTIVE SIZE USERS
512 0 0 [ 0R 0W]
• Copy the contents of loadfile from L:\FMS\Data\tmp\gonzales to CP file acloadfile by using ap command cpfport.
cpfport -i -m over L:\FMS\data\tmp\gonzales acloadfile
• Check the contents again after copying by cpfls command. Make sure acloadfile1 is there in the list
L:\FMS\Data\tmp\shooter>cpfls -ls acloadfile
CPF FILE TABLE
FILE TYPE CMP VOLUME
ACLOADFILE reg yes RELVOLUMSW
TRANSFER QUEUE MODE
RLENGTH MAXSIZE MAXTIME REL ACTIVE SIZE USERS
512 0 0 [ 0R 0W]
SUBFILES SIZE USERS
ACLOADFILE-LOADFILE1 17007 0 [ 0R 0W]
• Create a mml session.
• Now when the CMD file is copied in the CP file acloadfile, the command file will be executed using command IOCMI. Refer ALEX to know the details about the different procedure options available.
IOCMI:file=acloadfile-,proc=c;
Here we’ve used procedure C while executing IOCMI command. In this option remaining commands are executed even if some commands are not accepted or executed. But in Procedure a can be used in case output printout of each command is desired.
• Output logs can be captured to check for those commands which are not executed.
4 Summary
It is now clear that this procedure of handling mass commands will help us in a lot many ways in managing the critical activities involving mass change in subscriber’s profile. Till now, we’ve tested it with APG only. IOG possibility is yet to be explored.
The is a report on usage and advantages of the tool Gonzales which is very useful for mass command exercises in HLR with respect to O&M activities .
1 Introduction
The Tool Gonzales has been used to execute mass commands in HLR with APG and its been found very effective as the output results are much faster than the mml commands or even HGMCI Command, This can help us all in Important migrations like HLR, SCP or SDP migrations. The tool has been tested successfully in few important migrations in north.
• The commands can be checked for any possible error with different procedure options.
• The average time for executing 1 Lac mml commands is around 7 mins..
• The mass execution is always recommended in off peak hours as processor load shoots up to 30-40%.
• Error result in executing any command will be captured in the output logs and can be checked and corrected.
2 Existing difficulties in Handling Mass Command Activities
1. Executing DT’s of mml commands from normal desktops is quite time consuming. Hence all the activities involving mass change in subscriber’s profile in HLR results in either delay in completion of the migration activities or errors in running DT’s manually are found out after quite some time which may be leading to revenue loss or customer dissatisfaction.
2. Sometimes, speed of mml session becomes very slow due to more parallel sessions resulting in much time for executing mml commands.
3. To manage the multiple mml sessions in HLR sometimes
3 How we can use this for O& M Activities
We can use Gonzales and IOCMI command to run any mml command in HLR or any AXE node. The testing has been done for HLR with APG only.The complete procedure can be simply divided into three parts.
3.1 Prepare the load file through Gonzales
All mml commands which are to be executed in HLR can be captured in a CMD file. It is always recommended to put a maximum of 1 Lac commands in a single CMD file as it keeps the processor load of CP within safe limit. Following is the procedure to make loadfile from the tool
• Use the File menu and click “Open” option.
• Select the CMD file where you have kept the commands.
• The screen will show you list of three processed files as shown below

• The load file which is without any extension (first in the list as shown above) is the actual load file which is to be used further.
• It is recommended to rename the CMD filenames as acloadfile1 and next CMD filename as acloadfile2 and so on.
3.2 Transfer the load file in AP of HLR
After selecting the Load file, the next task is to transfer the file from your desktop to CP; the following steps will cover the procedure
• Login into the cluster of the the APG using pcAnywhere.
• Open the following directory in L drive of the APG
L:\FMS\Data\tmp\
• Make a new directory in the current “tmp” folder using mkdir command
mkdir Gonzales
• This will be a temporary folder which can be deleted after the completion of the activity.
• Now using the File Transfer Application of the APG.transfer the load file from your desktop to the following location of the APG.
L:\FMS\Data\tmp\gonzales
3.3 Executing Mass Commands
The Load file which is kept in the L drive of the APG is to be shifted to CP before running this load file. But we need a temporary CP file which will be used to keep the contents of this loadfile. ; the following steps will cover the procedure
• Create a CP file by using the command cpfmkfile, name the CP file as “acloadfile”
cpfmkfile -l 512 -c acloadfile relvolumsw
• Check the contents of the file by cpfls command.
L:\FMS\Data\tmp\gonzales>cpfls –l acloadfile
CPF FILE TABLE
FILE TYPE CMP VOLUME
ACLOADFILE reg yes RELVOLUMSW
TRANSFER QUEUE MODE
RLENGTH MAXSIZE MAXTIME REL ACTIVE SIZE USERS
512 0 0 [ 0R 0W]
• Copy the contents of loadfile from L:\FMS\Data\tmp\gonzales to CP file acloadfile by using ap command cpfport.
cpfport -i -m over L:\FMS\data\tmp\gonzales acloadfile
• Check the contents again after copying by cpfls command. Make sure acloadfile1 is there in the list
L:\FMS\Data\tmp\shooter>cpfls -ls acloadfile
CPF FILE TABLE
FILE TYPE CMP VOLUME
ACLOADFILE reg yes RELVOLUMSW
TRANSFER QUEUE MODE
RLENGTH MAXSIZE MAXTIME REL ACTIVE SIZE USERS
512 0 0 [ 0R 0W]
SUBFILES SIZE USERS
ACLOADFILE-LOADFILE1 17007 0 [ 0R 0W]
• Create a mml session.
• Now when the CMD file is copied in the CP file acloadfile, the command file will be executed using command IOCMI. Refer ALEX to know the details about the different procedure options available.
IOCMI:file=acloadfile-
Here we’ve used procedure C while executing IOCMI command. In this option remaining commands are executed even if some commands are not accepted or executed. But in Procedure a can be used in case output printout of each command is desired.
• Output logs can be captured to check for those commands which are not executed.
4 Summary
It is now clear that this procedure of handling mass commands will help us in a lot many ways in managing the critical activities involving mass change in subscriber’s profile. Till now, we’ve tested it with APG only. IOG possibility is yet to be explored.
Friday, December 17, 2010
Calculator Program
Instructions:
To download the Kathrein Scala Division Calculator program and run it locally from your hard drive (requires 10.51 MB) (Windows only.) :


To download the Kathrein Scala Division Calculator program and run it locally from your hard drive (requires 10.51 MB) (Windows only.) :
- Download and unzip the calculator file to a location on your hard drive.
- Open the hard drive copy of the \Calculator directory.
- Select and create a shortcut to the \Calculator\Menu Program.exe file.
- Move the Shortcut to your desktop.
- Click here to download program as zip file.


Friday, November 19, 2010
WIRELESS NETWORKING (Part 5)
Some Wireless Network Specifications
Here we will learn some technology specifications that can be used as a base reference in the development of network infrastructure without wires, whether indoor or outdoor, even MAN.
A. Fixed Wireless
is a wireless technology where the sender and receiver occupy a fixed location such as home or office. Applying this technology is MMDS (Multichannel Multipoint Distribution Service), LMDS (Local Multipoint Distribution Services), Point-to-Point Microwave, or WLAN.
A.1 MMDS (Multichannel Multipoint Distribution Service)
operate in the spectrum of 2.5 - 2.7 GHz with a width of 200 MHz. Throughput which can be given is 1-2 Mbps. The distance that can be taken is 35 mile from the radio port controller (RPC) which is based on the strength of signal.
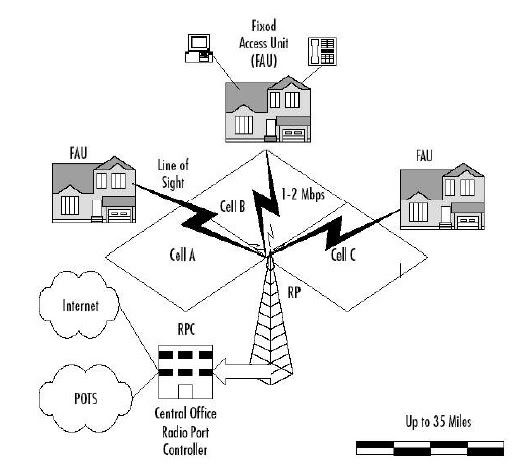
A.2 LMDS (Local Multipoint Distribution Services)
a microwave communication systems with models of point-to-multipoint who works on a frequency of 20 GHz. Bandwidth provided to 500 Mbps. Typically used for short distances that require bandwidth high, such as campuses, companies, etc..
Example:
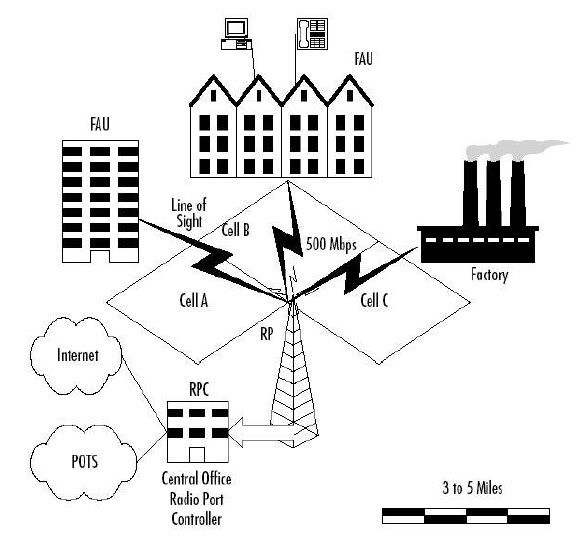
A.3 Point-to-point microwave
is a technology line-of-sight is very influenced by multipath and the absorption of some other object, such as MMDS and LMDS
A.4 Wireless LAN
Connection type Wireless LAN
● W-LAN Outdoor - used for connecting devices in the outdoors, follow the 802.16 standard
● W-LAN Indoor - used for connecting devices in the indoors, follow the 802.11 standard
Use of wireless technology for local networks, can follow standardization of IEEE 802.11x, where x is a sub standard which consists of:
• 802.11 - 2.4 GHz speed up to 2Mbps
• 802.11a - 5GHz speeds up to 54Mbps
• 802.11a 2X - 5GHz speeds up to 108Mbps
• 802.11b - 2.4 GHz speeds up to 11Mbps
• 802.11g - 2.4 GHz speeds up to 22Mbps
• 802.11n - 2.4 GHz speeds up to 120Mbps
802.11 MAC is known DFWMAC (distributed foundation wireless MAC). Flowchart of the algorithm is:
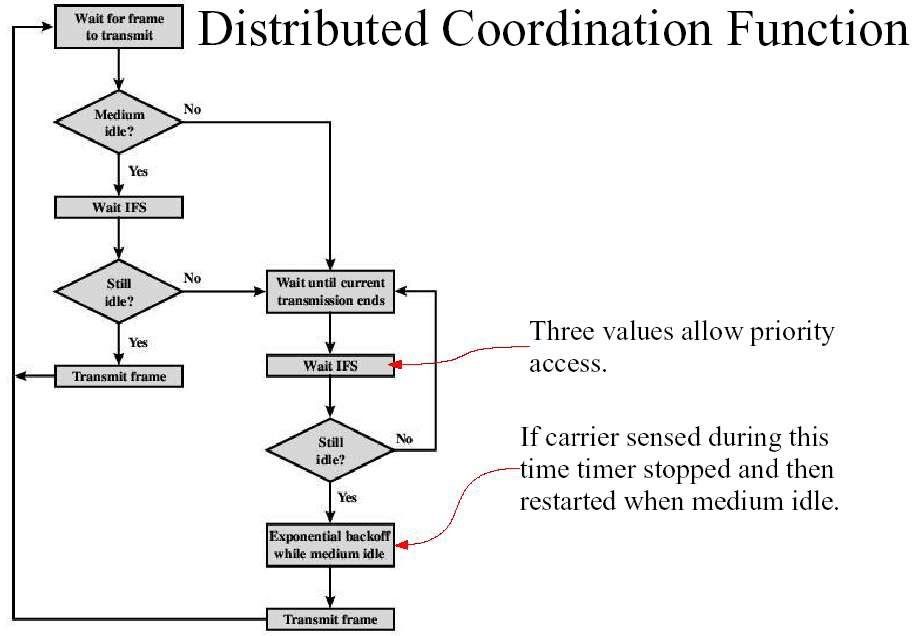
Here are the types of W-LAN devices
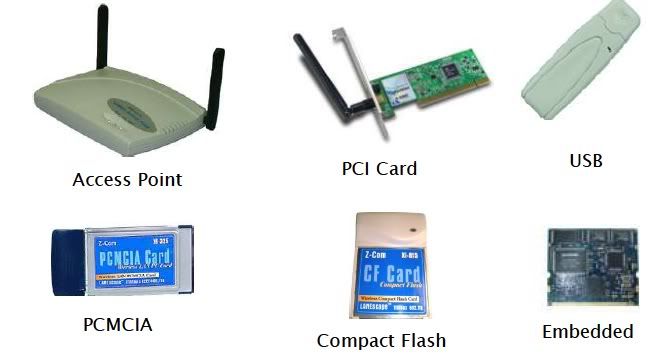
Examples of W-LAN device specifications
● Output Power
• 5150 ~ 5700 GHz
15 dBm (+ / - 2 dB) for 6 Mbps
12 dBm (+ / - 2 dB) for 54 Mbps
• 5745 ~ 5850 GHz
15 dBm (+ / - 2 dB) for 6 Mbps
10 dBm (+ / - 2 dB) for 54 Mbps
● Antenna Gain
2.81dBi Max.
● Receiver Sensitivity
Min. -67dBm for 54 Mbps @ 10% PER
Min. -73dBm for 36 Mbps @ 10% PER
● Power Consumption
520 mA at transmit mode
310 mA at receive mode
Use of specification 802.16 (wireless broadband) to the network outdoor is very expensive, so there is no harm if we also using the 802.11 specification for these outdoor networks. There a few things to note:
● Radio 802.11b only has 11 channels
● The installation must follow the rules of Line of Sight
● Requires the tower if two points are at different levels
● Use a small power should really be taken into account
● Must overcome the interference that occurs Using the PCMCIA in the computer
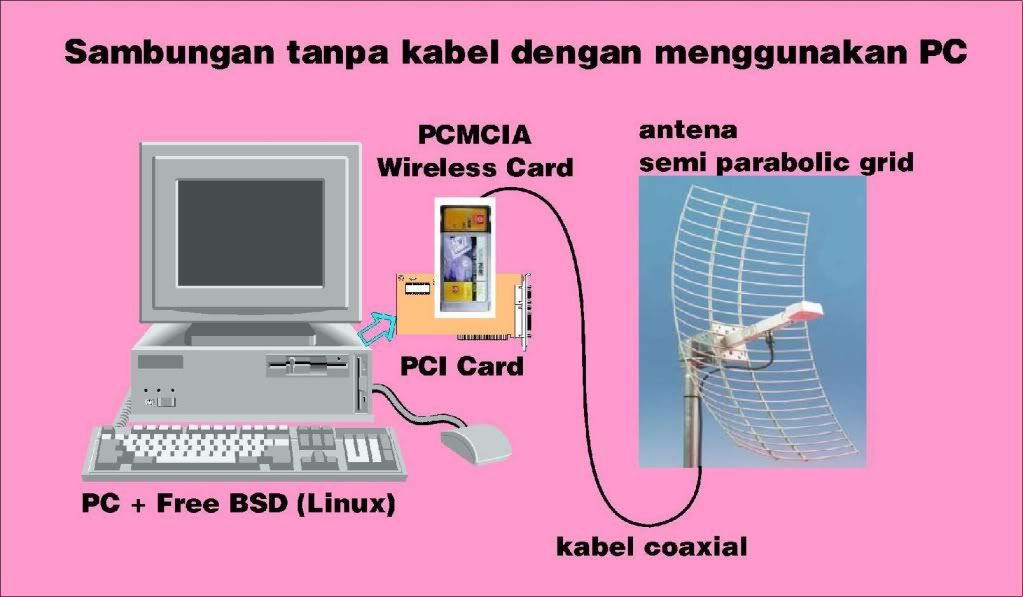
Using the Access Point to connect to external antenna
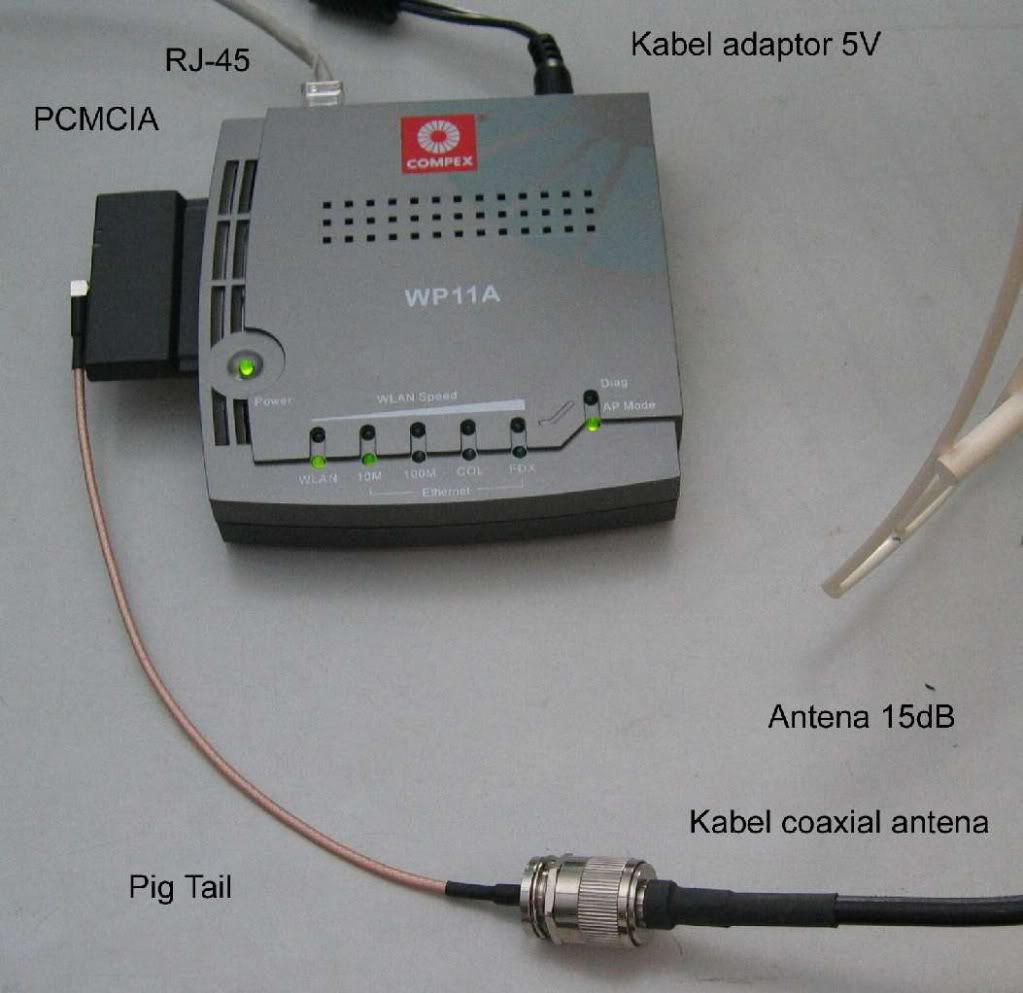
802.11 is used in indoor known as the HotSpot and standards WiFi
● One access point can not serve more than 50 clients
● Installation of access points should not interfere with each other frequencies (Remember: there are only 3 frequencies are not mutually stacked)
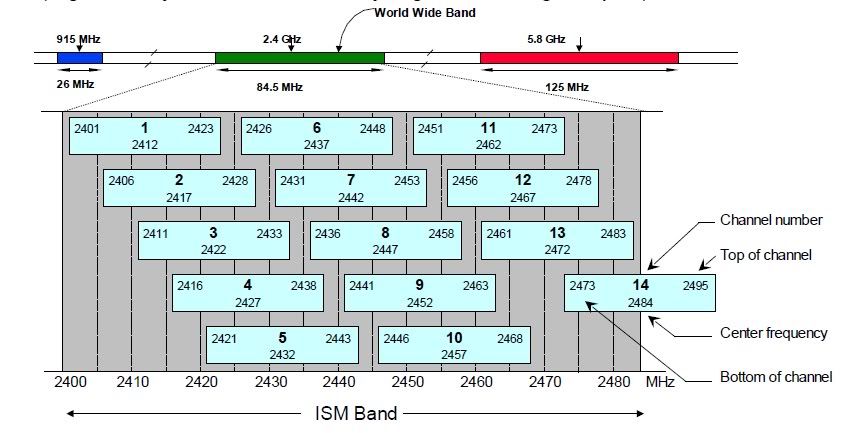
WIRELESS NETWORKING (Part 4)
RF Channelling
All RF communications require a fairly small segment of the total RF spectrum is available. One segment is called the channel (Channel). To allow for multiple signals are used simultaneously, each channel requires a separate frequency with the help of FDMA. The frequency of one channel is the center frequency of a single spectrum canal. The width of the channel spectrum is called the channel bandwidth.

The use of such channel, highly depends on the type communication. In the CB radio (handy talky), using a type halfduplex, so it is quite necessary one channel only. In multi-channel systems, such as mobile phones, used for supports full-duplex type. In order to implement full-duplex, then The second channel is made in addition to the main channel, which allows two-way can dirambatkan simultaneously. Another example is the two-channel receiver in a stereo system (the left channel and right channel) FM radio. With the increasingly widespread use of RF for many purposes, then the channel utilization is considered, so that later emerged concept of frequency reuse (Frequency Reuse). Examples of the use of frequencies between the radio station in Yogyakarta with at jakarta could use the same single frequency. This probably because of the distance that had exceeded the scope of the ability of the FM signal.

On a mobile phone communication, also applied the concept of frequency reuse This, first pioneered by the AMPS (Advanced Mobile Phone Service). Time Division Multiple Accessing (TDMA) TDMA is used to add capabilities FDMA. Each channel is divided into several time slots, where each one slot used by one user. An example is the GSM (Global System for Mobile Communication) is a type of TDMA. Code Division Multiple Access (CDMA) CDMA is the latest technology for multiple access. CDMA is not divide a set of frequencies used to be several channels. CDMA gives a unique code for each signal and then combines all the signals into one large channel. CDMA wireless technology known as 3G phones because of very efficient in bandwidth usage and also very secret because uniquely encoded communications.
Wednesday, November 17, 2010
WIRELESS NETWORKING (Part 3)
Line-of-sight
Straight path is clear of obstacles between the receiver and sender called line-of-sight. For high frequencies require line-of-sight more better than low frequency.
There are two terms
● Optical Line-of-sight, the two stations can optically see each other
● Radio line-of-sight, no reflection or
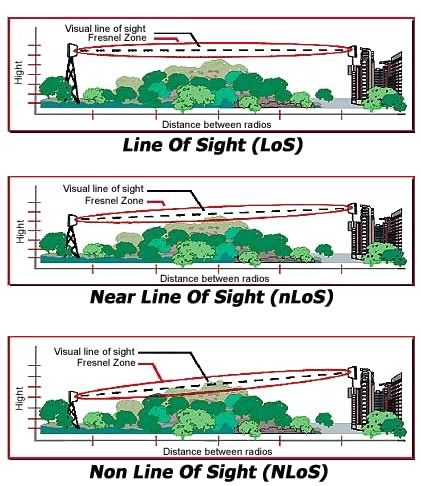
There are 4 parameters that are used to calculate the W-LAN systems outdoor work well:
● System Operating Margin (SOM), associated with strength sender, the type of antenna, coaxial cable length and distance.

As an illustration of calculation, on the 802.11b specification, the recipient (Receiver) has a sensitivity of -80 to -85 dBm. On the client side, normally we use a directional antenna, such as antenna parabola with the addition of 19-24 dBm. Loss of signal for coaxial cable between 2-3 dB. To cover the operating margin (SOM) 10-15 dB is highly dependent on type of antenna used on the Access Point. If using an antenna (Discussed next) omnidirectional with the addition of 10-12 dB, we get a coverage area of 4-5 km. If using a sectoral antenna (Directional).with the addition of 12-14 dB, we can cover 6-8 Km.
Free Space Loss (FSL): lost power after a distributed radio at a certain distance.

Example:
FSL for a distance of 5 km at a frequency of 2.4 GHz is 114 dB. Normally (by Onno W. Purbo) per distance of 1 km at 2.4 GHz will have the FSL in the range of 100dB.
Fresnel Zone Clearance (FZC), to see the need for high antenna to go through obstacle.

Fresnel Zone is an area not there are barriers between the two terminal. Usually for the 1st 80% Fresnel Zone. formula:
R = 43.3 sqrt (d / 4f)
Where:
R : Radius Freznel Zone
d : Path length 2 node


Straight path is clear of obstacles between the receiver and sender called line-of-sight. For high frequencies require line-of-sight more better than low frequency.
There are two terms
● Optical Line-of-sight, the two stations can optically see each other
● Radio line-of-sight, no reflection or
line-of-sight Calculation is necessary when you build wireless network outside the building (outdoor). You can find how to calculate Link budget for outdoor Propagation in this blog. we can used excell to provide a calculator to help you calculate radio links outdoor.
There are 4 parameters that are used to calculate the W-LAN systems outdoor work well:
● System Operating Margin (SOM), associated with strength sender, the type of antenna, coaxial cable length and distance.

As an illustration of calculation, on the 802.11b specification, the recipient (Receiver) has a sensitivity of -80 to -85 dBm. On the client side, normally we use a directional antenna, such as antenna parabola with the addition of 19-24 dBm. Loss of signal for coaxial cable between 2-3 dB. To cover the operating margin (SOM) 10-15 dB is highly dependent on type of antenna used on the Access Point. If using an antenna (Discussed next) omnidirectional with the addition of 10-12 dB, we get a coverage area of 4-5 km. If using a sectoral antenna (Directional).with the addition of 12-14 dB, we can cover 6-8 Km.
Free Space Loss (FSL): lost power after a distributed radio at a certain distance.

Example:
FSL for a distance of 5 km at a frequency of 2.4 GHz is 114 dB. Normally (by Onno W. Purbo) per distance of 1 km at 2.4 GHz will have the FSL in the range of 100dB.
Fresnel Zone Clearance (FZC), to see the need for high antenna to go through obstacle.

Fresnel Zone is an area not there are barriers between the two terminal. Usually for the 1st 80% Fresnel Zone. formula:
R = 43.3 sqrt (d / 4f)
Where:
R : Radius Freznel Zone
d : Path length 2 node
f : frequency

Here is a table FZC to 1-7 km distance to the terminal Wi-Fi operates at 2.4 GHz

Antenna bearing, tilt down the antenna and the coverage radius antennas need to know to cover an area.

Where Hb is the height of the BTS antenna and receiver antenna height Hr is and A is the angle in radians.
For example: for a BTS with a height of 30 m to cover distance of 3 km, take the angle of degrees to achieve 0:35 receiving antenna height of 10 m. In some cases we need the approximate area of coverage can be calculated by the formula:

Where H is the height of the BTS, A is the antenna tilt angle, BW is the width of coverage (beam).
For example:
to an access point with antenna height 30 m, and beam width 10 degrees with 0.2 degree angle, we will achieve the inner 150 m radius and outer radius of 8.7 km.
Antenna
The antenna is needed if we install a wireless network infrastructure for outdoor. The antenna will change from electric signals into electromagnetic signals. The amount of energy that can be amplified by the antenna on the side recipient or the sender is called the antenna gain.
Directional Antenna
antenna which amplifies the signal from the sender to dirambatkan on one or two directions. There are two categories: parabolic and phased arrays. Parabolic used for medium or long distances and can provide gain
between 18-28 dBi. Example:
Yagi Phased Array
This antenna is suitable for short distances with a gain of 7-15 dBi
● Sectoral Antenna
is a phased array type that divides the coverage area of a circle into several sectors to help the channel allocation and use of repeated. A sectoral antenna has a beam of approximately 120 degrees that divides one area of the circle into 3 areas.
By used sectoral antenna would be more efficient rather than the use of omnidirectional installation.
WIRELESS NETWORKING (Part 2)
Radio Signal Propagation
In order for a wireless network to function, signals must have a path from sender to receiver, arriving with the signal strength is still sufficient to be translated. Signal strength can be measured by two units:
• dBm (decibels above 1 mW) in units of Watts or Volt
• S / N Ratio (Singnal-to-Noise) shows the ratio between the power signal and noise power. For digital signal, S / N Ratio is less than at S / N for analog signals.
Another thing to note for the propagation of radio signals is attenuation (attenuation) signals. The weakening can be affected by distance. The picture signal attenuation can be shown with light from two different sources.
Ommidirectional
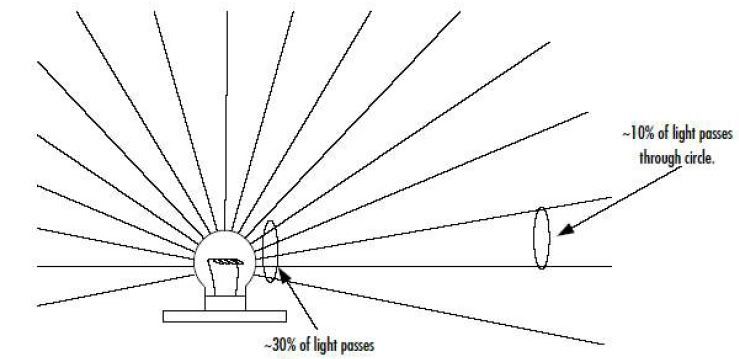
Directional
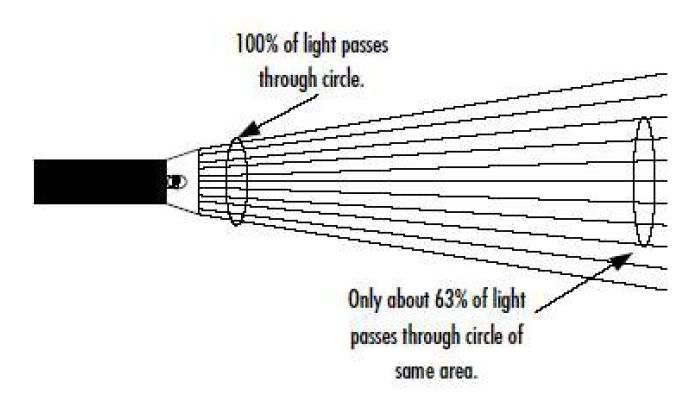
The formula for converting Watts to dBm or vice versa:
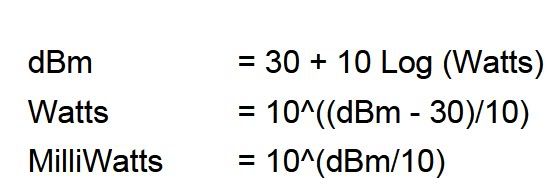
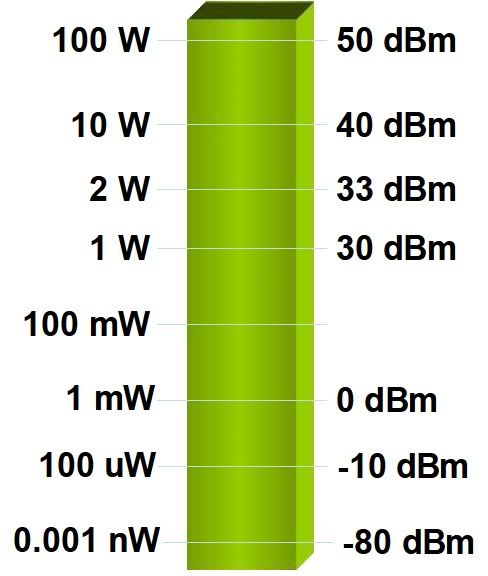 Electromagnetic waves can not cut trough the earth element, likes: mountains, valleys, so the need to elevate the recipient or sender in the mountains or tall buildings.
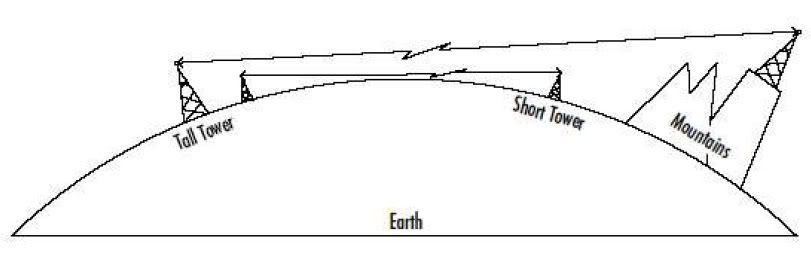
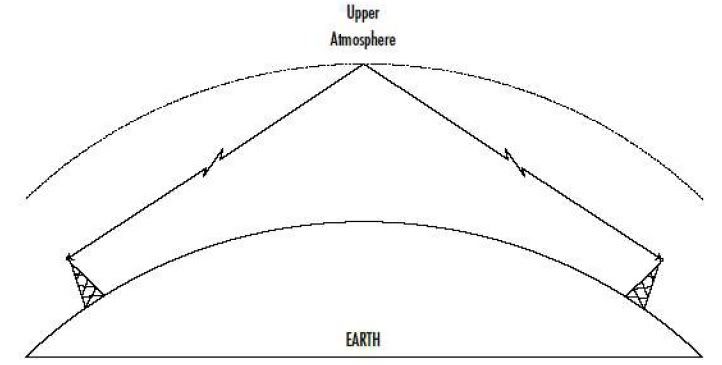
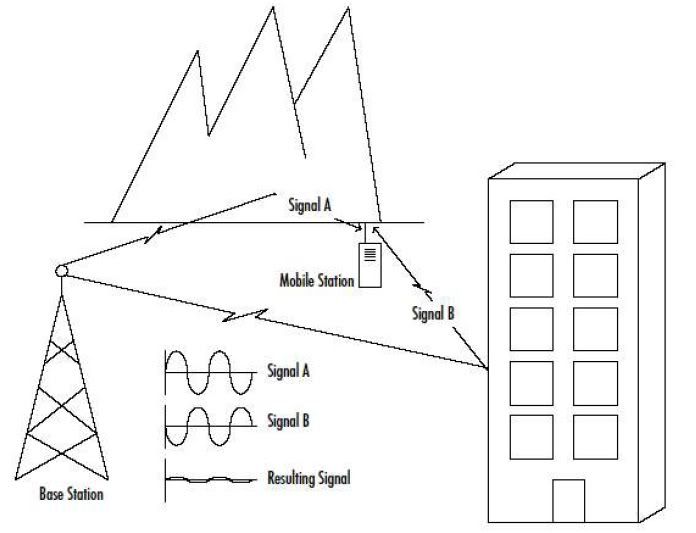
In order for a wireless network to function, signals must have a path from sender to receiver, arriving with the signal strength is still sufficient to be translated. Signal strength can be measured by two units:
• dBm (decibels above 1 mW) in units of Watts or Volt
• S / N Ratio (Singnal-to-Noise) shows the ratio between the power signal and noise power. For digital signal, S / N Ratio is less than at S / N for analog signals.
Another thing to note for the propagation of radio signals is attenuation (attenuation) signals. The weakening can be affected by distance. The picture signal attenuation can be shown with light from two different sources.
Ommidirectional
Directional
The formula for converting Watts to dBm or vice versa:
The cause of signal attenuation is rain. A signal that has higher frequencies will have a density (wavelength) more shorter. Electromagnetic waves can pass through some objects, but also could be reflected by an object. This reflection is often called baunching or scattering. Baunching can decrease the performance of a system and can also enhance other performance. As an example of a radio broadcast signal PM could be reflected by a layer of Earth's atmosphere.
Some applications that use low frequencies to using the atmosphere as a reflector to increase the distance scope. But for high frequencies can not be reflected in layers of the atmosphere, because of the high frequency will be absorbed by the atmosphere. So for high frequencies required an artificial reflector, which called satellites. Not all obtained from bounching good result, one of them called multipath scattering in mobile communications.
Multipath Scattering is a signal that reaches the recipient of several path is the result of bounching. If the signal is received outside of the phase, then the signal is canceled. If the signal received in phase but not synchronized, will be received echo signal. Examples of applying this is CDMA (Code Division Multiple Accessing)
WIRELESS NETWORKING (Part 1)
Wireless Network Is the the technology of data transmission from one point to point without physical cable, including radio, cellular, infrared, and satellite.Radio is the transmission and reception of signals with wave electromagnetic wirelessly. Electromagnetic Waves presenting all frequencies. Spectrum Radio Frequency (RF) occupies a range of 9 KHz - 300 GHz.
Wave Anatomy :
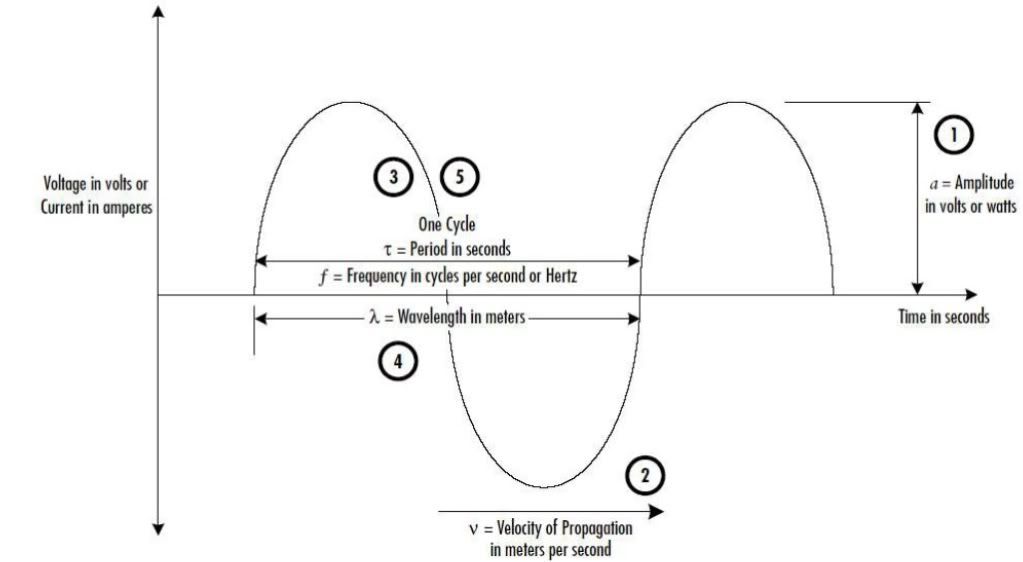 And The frequency calculate with:
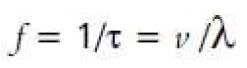 A radio signal sent to a another point, the signals must be modulated into a frequency signal (carrier), which is a constant and higher frequency of the input signal frequency. Reason modulation is required:
1. For a better transmission, because the radio signals that we send mostly using low frequency
2. To allow multiple signals simultaneously transmitted without disturbing each other (interference). Read the back Frekuency Division Multiplexing (FDM)!
Analog Modulation:
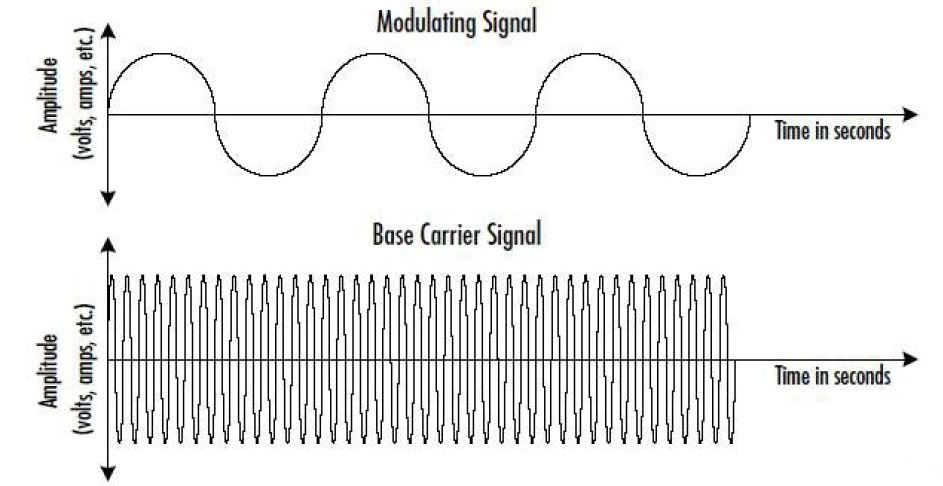
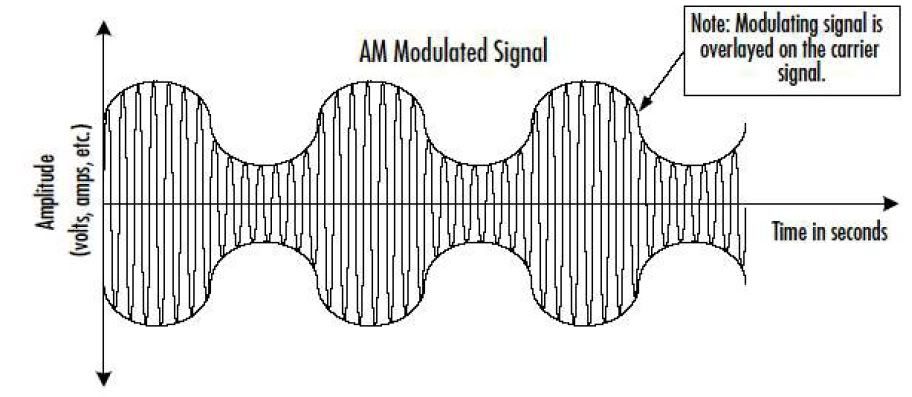
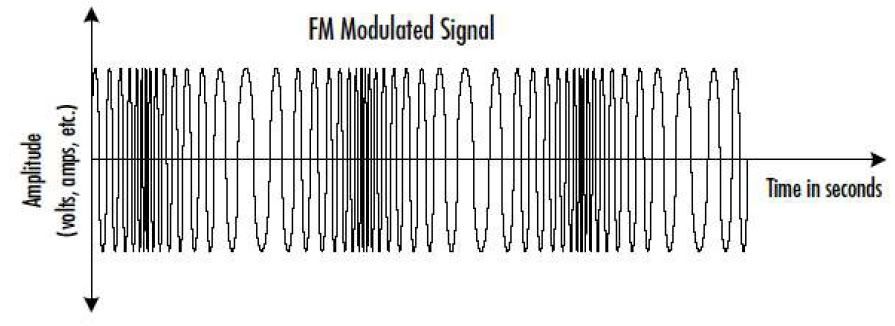
Digital Modulation:
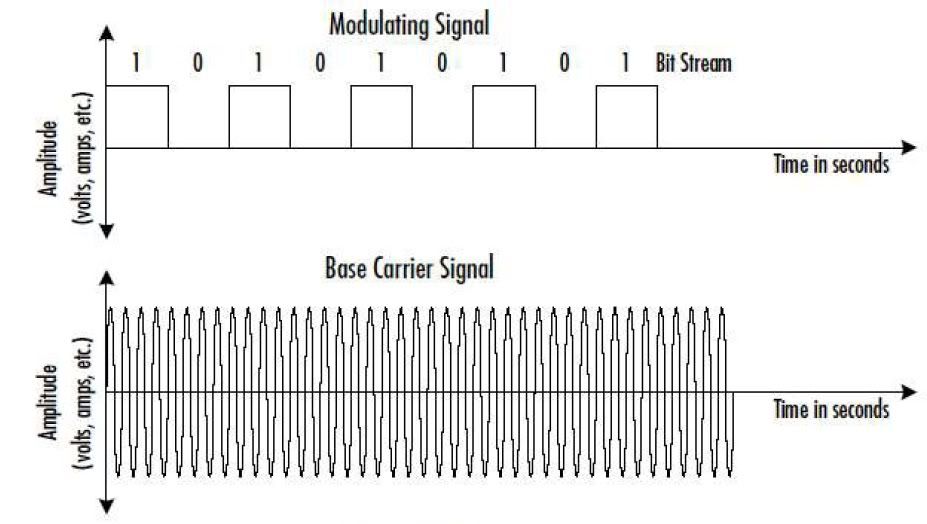
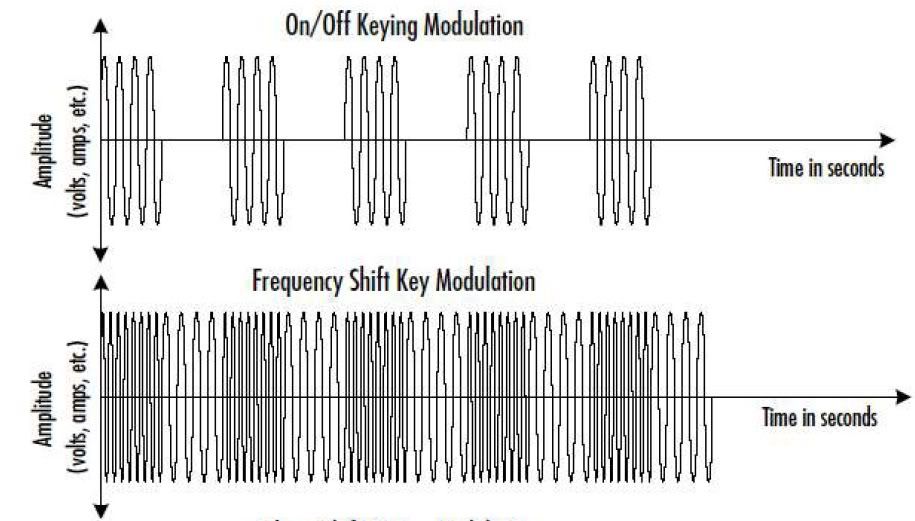
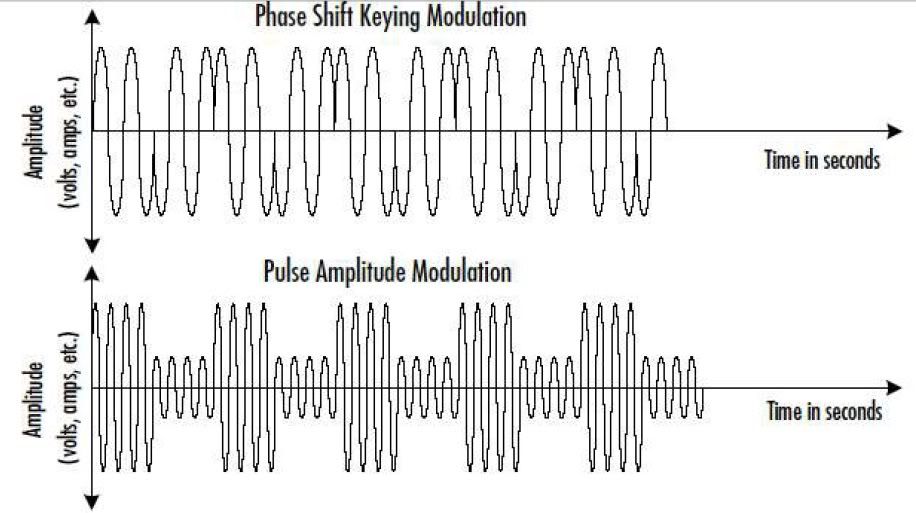 FSK is used in the 802.11 specification for modulation Frequency Hopping Spread Spectrum (FHSS) and Direct Sequence Spread Spectrum (DSSS).
Wave Anatomy :
1. For a better transmission, because the radio signals that we send mostly using low frequency
2. To allow multiple signals simultaneously transmitted without disturbing each other (interference). Read the back Frekuency Division Multiplexing (FDM)!
Analog Modulation:
Digital Modulation:
Subscribe to:
Posts (Atom)